Customer Touchpoints KPI reporting template

Analyze the performance of your Customer Touchpoints in a location context

Use Cases

What is the performance of your Customer Touchpoints?

Every Customer Touchpoints Network has its KPIs. With our KPI reporting template you can easily keep track on fullfilment of those KPIs directly on an interactive map.

Are your Customer Touchpoints fullfilling the location potential?

It is not only about the KPIs. Every location has different location potential and fullfilment of the KPIs might be connected to it. Find out if your location is fullfilling its potential.

Are there any underperforming touchpoints and how to fix it?

Even if your touchpoits are in locations with strong potential they might not be fullfiling the KPIs. Sometimes it can because of bad customer service or high competitive pressure. This solution allows you to get to the bottom of the problem.

Features

Analyze the performance

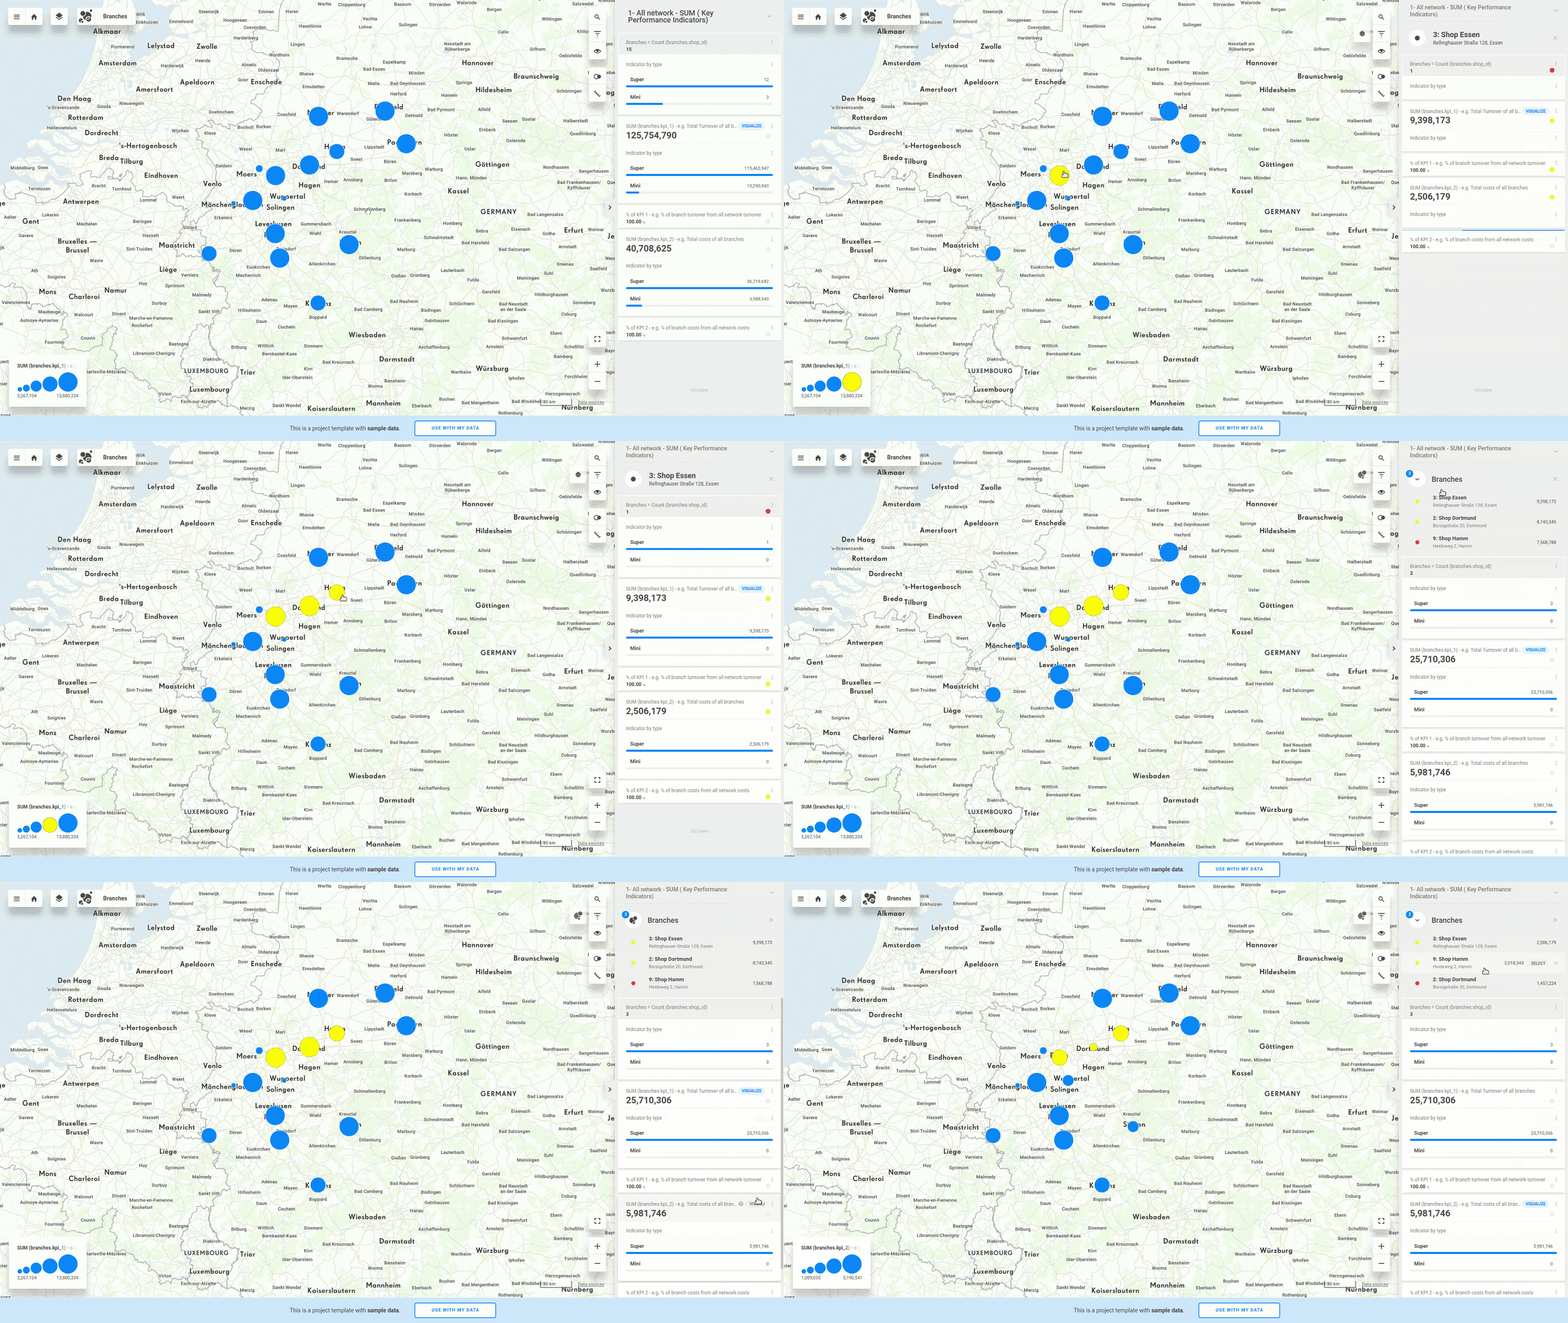
The great thing about analytics directly on a map is its interactivity and clear overview of your customer touchpoints. The size of the dot indicates the KPI fullfilment.

Our solution allows you to compare the performance of multiple touchpoints.
Analyze the surrounding area

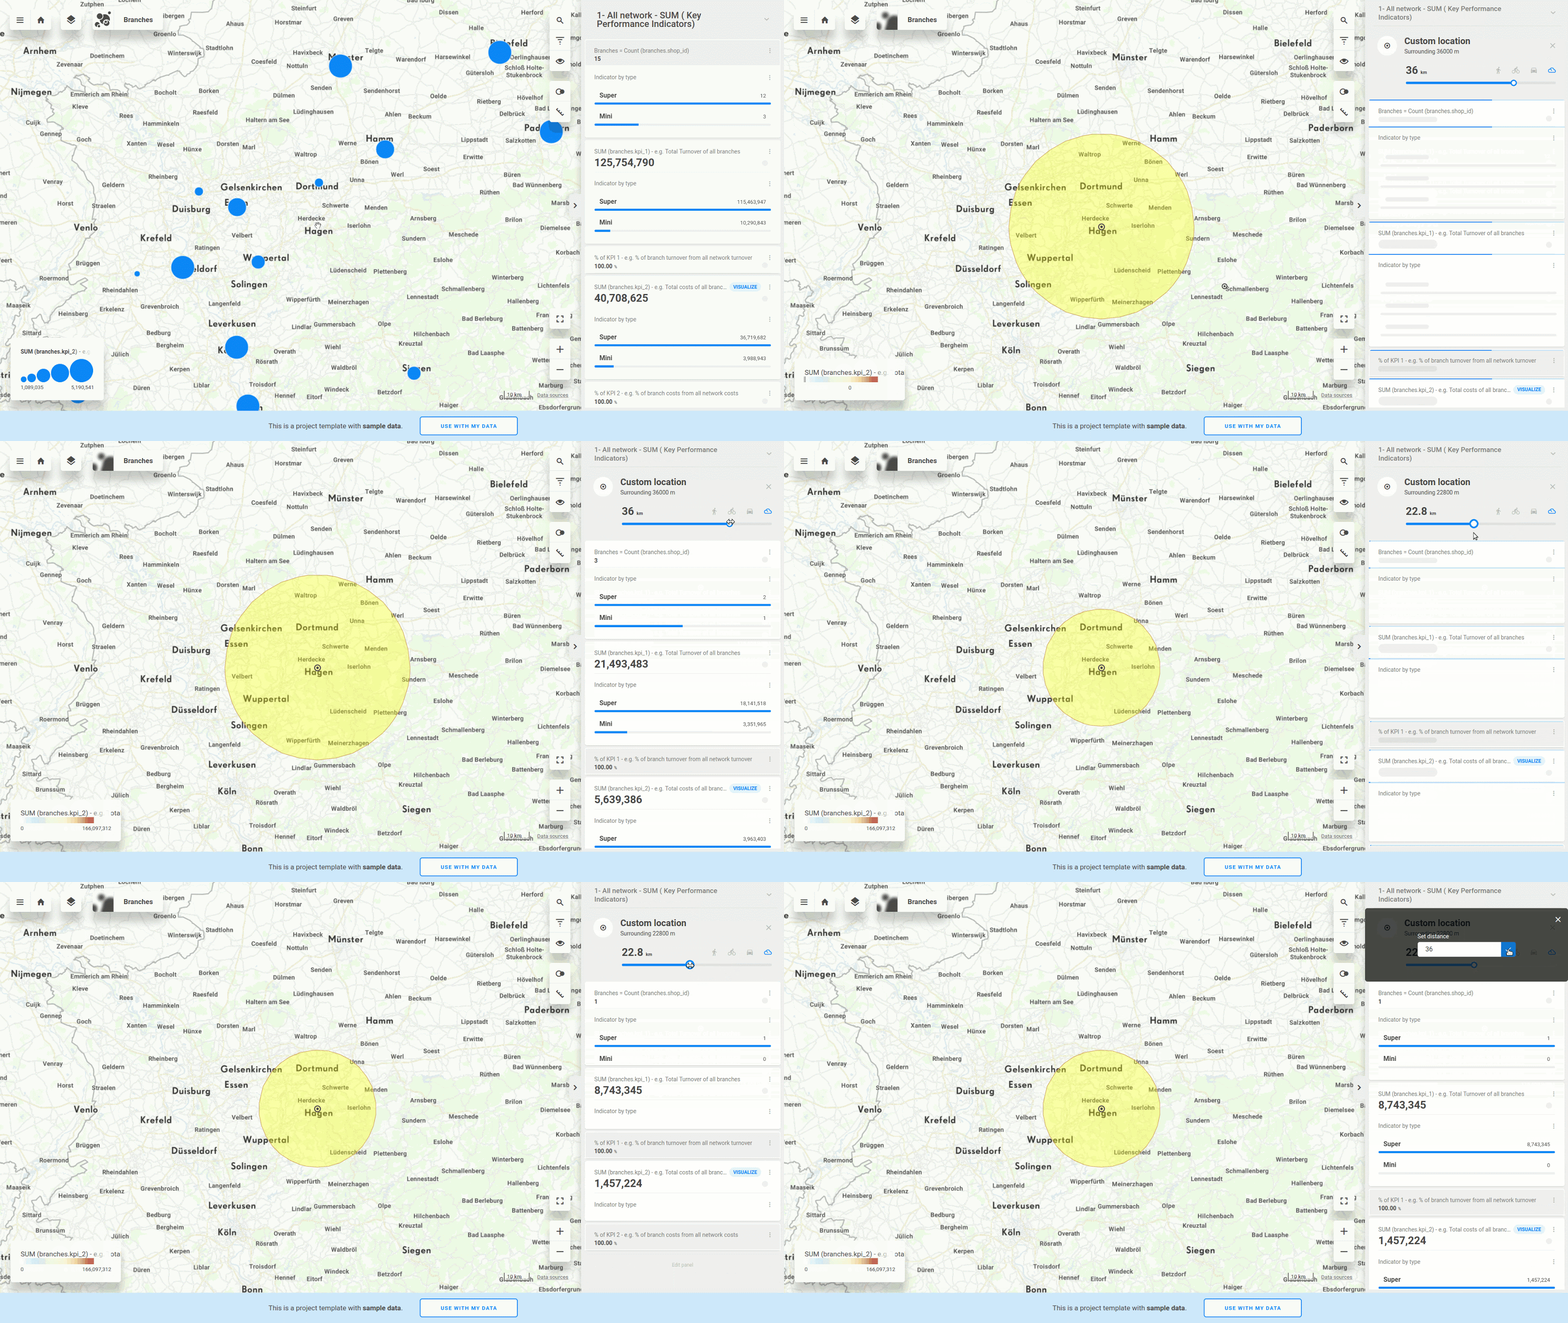
What is in the surrounding area is very important for the performance of your customer touchpoints. Our solution allows you to analyze what is the market potential in the selected walking/biking/driving distance.

Get to the bottom of the problem

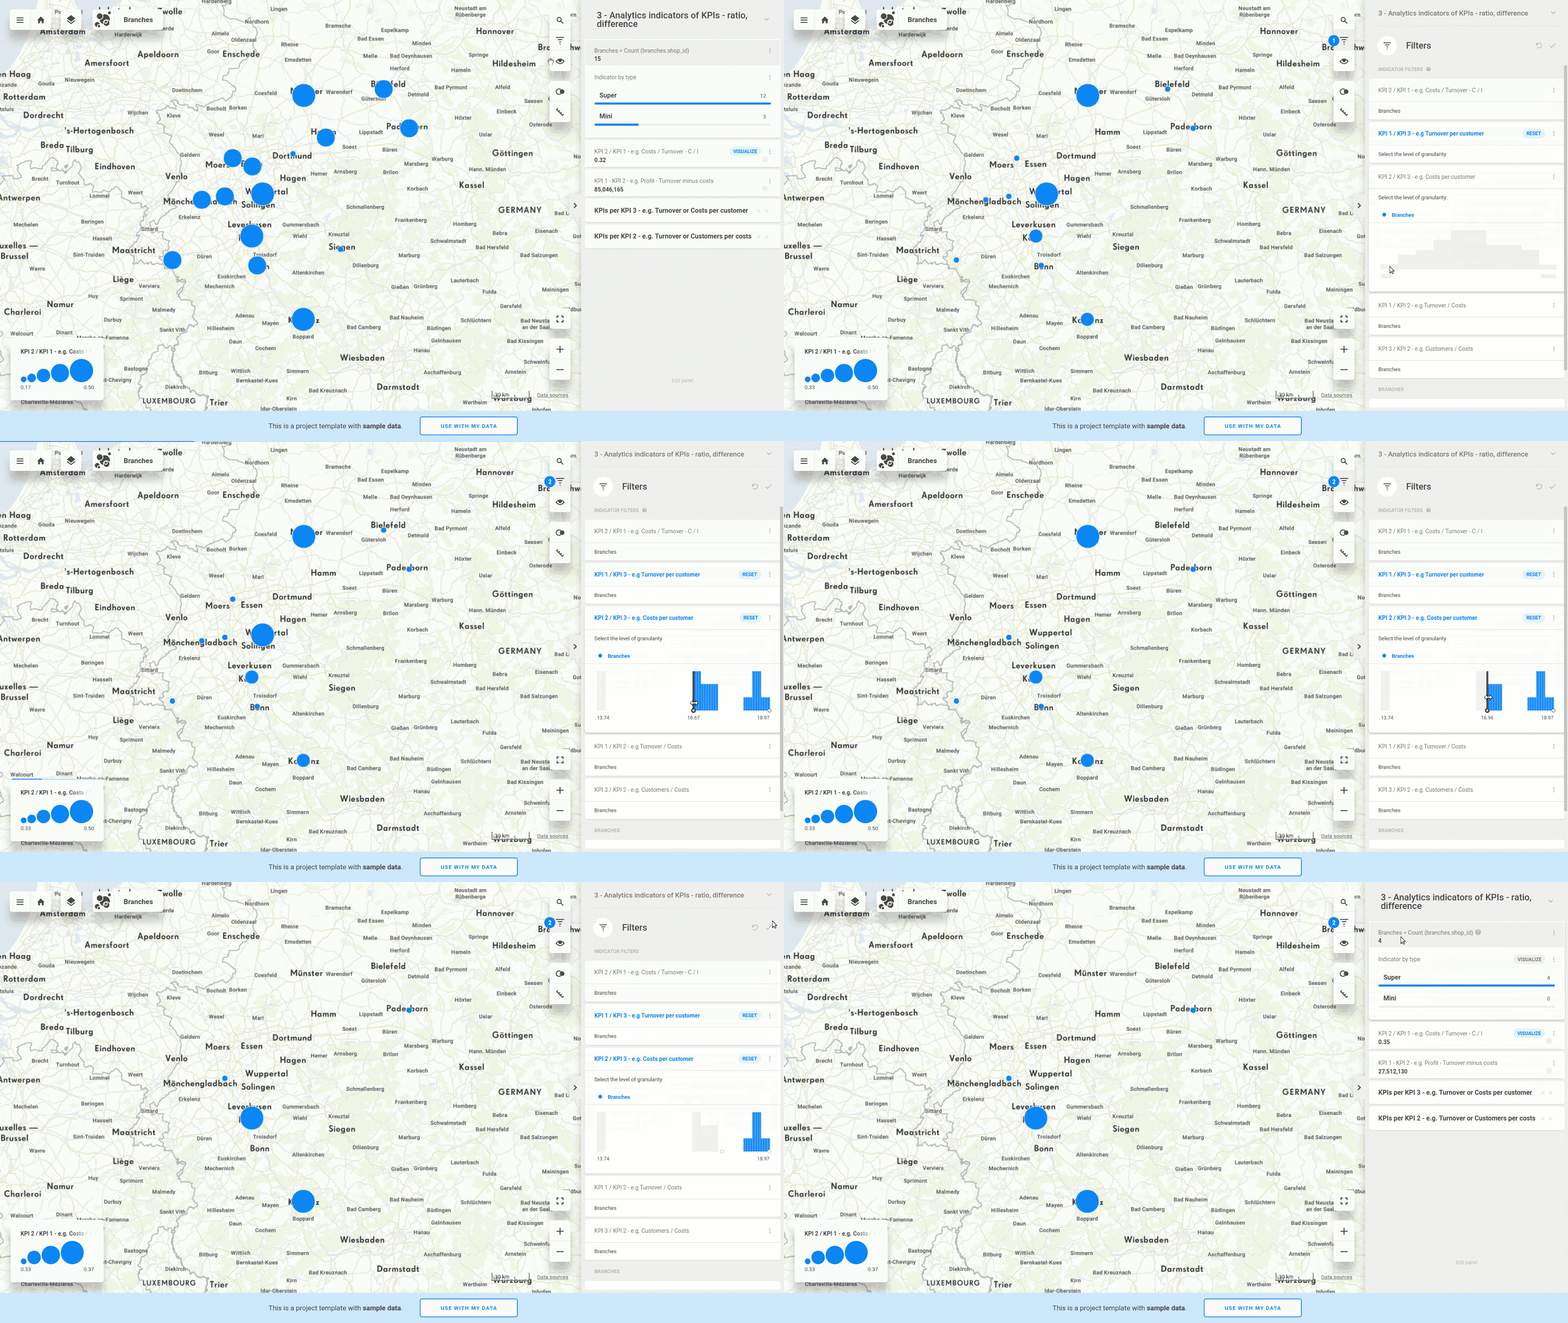
Use to filters to undercover the underperforming customer touchpoints to get to the bottom of the problem. 
Want a custom solution?