Barbora Hinnerova
LOCATION DATA
7 MINS READ
Mobility Data vs. POI Data: How to Choose the Right Data for Site Selection
See how mobility data and POI models support site selection, catchment analysis, and retail expansion, and understand when each dataset delivers the most value.

How Location Data Improves Site Selection, Retail Expansion, and Market Analysis
Many site selection and retail expansion decisions fail not because companies lack experience, but because they rely on assumptions about how people move, shop, and spend time in specific locations. Location Intelligence reduces this uncertainty by replacing assumptions with spatial analysis and behavioural data. However, different datasets answer different location planning questions.
Two of the most commonly used approaches in retail location analysis and network expansion are human mobility data and POI-based location models, such as CleverMaps Business Attractiveness.
These datasets are often compared as alternatives, but they describe demand and movement patterns in fundamentally different ways. Understanding how they differ is essential for selecting the right data for site selection, catchment analysis, and market expansion strategy.
Reality vs. Model in Location Intelligence
Every location planning project typically revolves around two core questions. The first asks what is happening in a location today. The second focuses on what could happen there based on structural conditions.
Human mobility data answers the behavioural question by capturing aggregated and anonymized population movement. It reveals where visitors travel from, how frequently they visit specific locations, how long they stay, and how movement patterns change during different times of day, weekdays, weekends, or seasonal peaks. This makes mobility data particularly valuable for understanding real catchments and visitor flows.
POI-based models approach location analysis differently. Instead of observing visits directly, they estimate exposure and location attractiveness based on accessibility, surrounding amenities, complementary services, and competitive pressure. In retail site selection and commercial real estate analysis, this structural perspective helps identify locations that are likely to generate demand under the right conditions.
Both datasets describe movement in geographic space. The key difference is that mobility data reflects observed behaviour, while POI models estimate location potential based on spatial context.
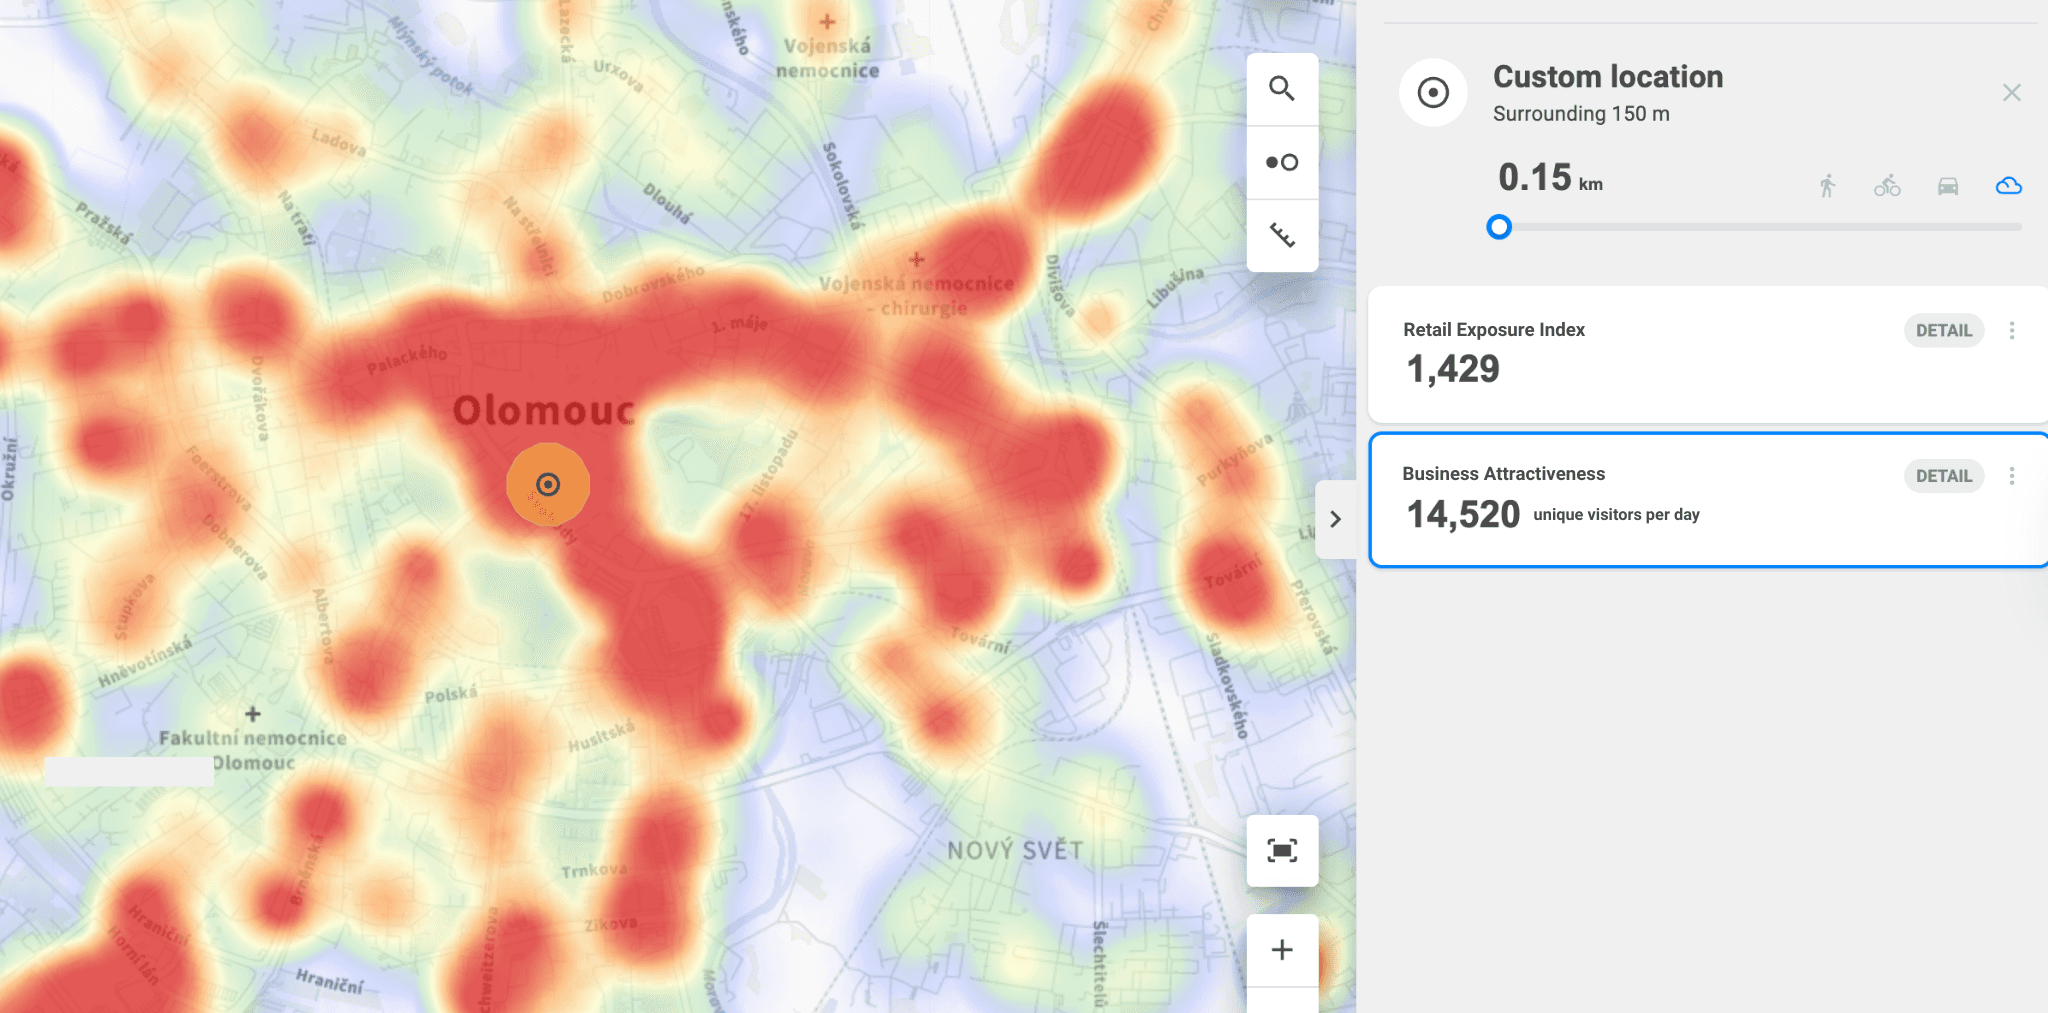
Business Attractiveness of a location visualized in CleverMaps Studio.
Key Differences Between Mobility Data and POI-Based Models
Behavioural vs. Structural Location Analysis
Mobility datasets provide insight into how people actually move within cities and regions. They allow analysts to identify visitor origins, analyze real catchment areas, evaluate network cannibalization, and understand how external factors such as tourism, commuting flows, or infrastructure changes influence footfall and store performance.
POI-based Business Attractiveness focuses on evaluating the structural strength of a location. By analyzing the density, importance, and mix of surrounding destinations, it estimates the number of visitors likely to be present around a location during a typical day.
This allows companies to compare potential store locations across entire cities, metropolitan areas, or countries using a clear and interpretable demand indicator rather than an abstract index, such as CleverMaps previous Exposure Index. This type of modelling is particularly useful when screening markets or identifying expansion opportunities across large territories.
Spatial Resolution in Urban and Regional Location Analysis
Mobility data typically delivers strong spatial accuracy in densely populated urban environments where data coverage is highest. In smaller towns or rural areas, data resolution may be lower due to reduced population density and signal availability.
POI models operate at the level of individual addresses and points of interest, which enables detailed comparison between candidate sites. Their accuracy, however, depends on the completeness and quality of POI datasets and retail infrastructure mapping.
Neither mobility data nor POI models capture movement at the level of specific storefront entrances or building access points. Achieving that level of precision usually requires manual counting or physical sensors. Both datasets should therefore be understood as analytical estimations of movement patterns rather than exact visitor counts.
The Role of Time in Catchment and Footfall Analysis
One of the strongest advantages of mobility data in site selection and retail performance analysis is its temporal dimension. It allows companies to analyze hourly footfall patterns, weekday versus weekend traffic, seasonal fluctuations, and the impact of major events or tourism cycles. This dynamic insight is essential for understanding store performance variability and customer behaviour shifts.
POI-based location models provide a stable structural snapshot of demand. They describe long-term location attractiveness but do not capture behavioural fluctuations over time. Their strength lies in enabling consistent market comparison across regions and providing a reliable baseline for expansion planning.
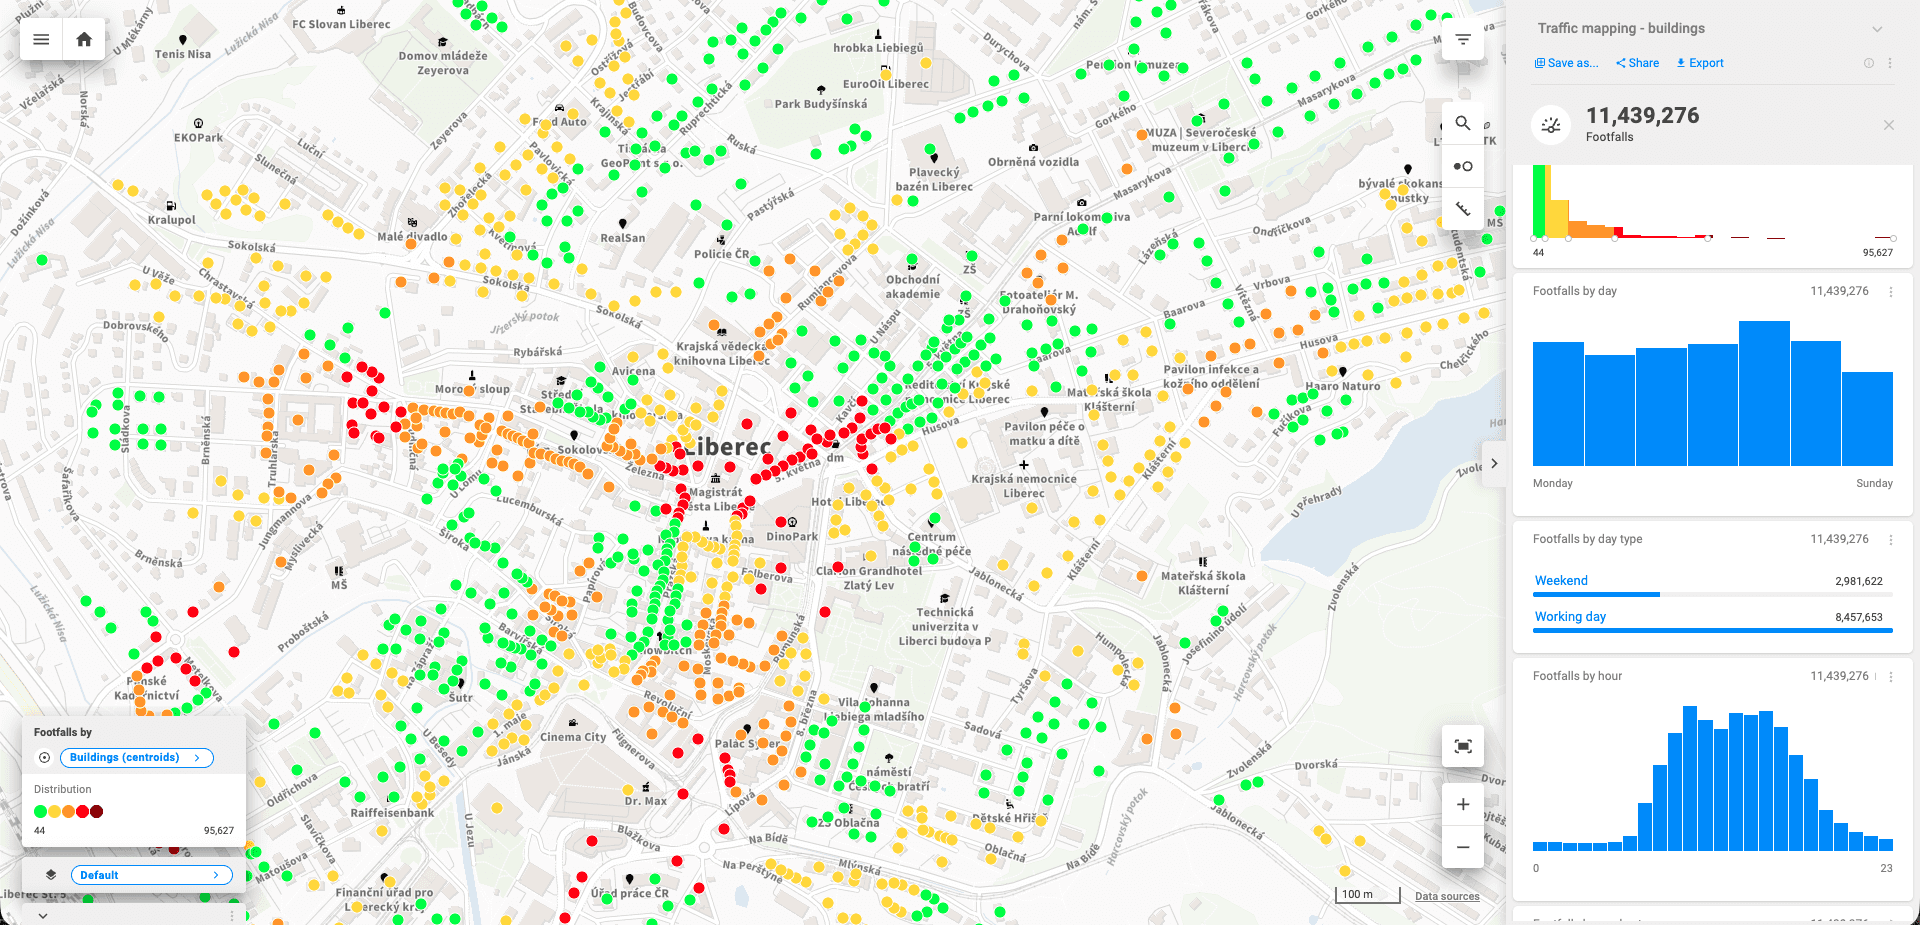
Mobility-based footfall analysis in CleverMaps Studio.
Cost, Availability, and Scalability of Location Data
Human mobility data usually involves licensing, privacy compliance, and analytical integration. Because of these requirements, it is typically used in high-value location planning projects where behavioural insights significantly reduce investment risk, such as large retail rollouts or branch network optimization.
POI-based Business Attractiveness models are faster to deploy and provide broad geographic coverage. They are commonly used for large-scale market screening, white space analysis, and early-stage site selection, where companies need to evaluate many potential locations quickly.
Choosing Location Data Based on Expansion Strategy and Decision Risk
Selecting the right dataset depends primarily on the scale and risk of the location decision rather than technical preference.
When companies evaluate a single store location or enter a new regional market, the main goal is usually to identify structurally strong areas and eliminate high-risk sites. In these situations, POI-based Business Attractiveness typically provides sufficient analytical depth. It enables consistent comparison across neighbourhoods using estimated visitor presence derived from surrounding activity patterns and supports fast site selection, often combined with demographic analysis, accessibility modelling, and on-site validation.
As retail or service networks expand, location planning increasingly depends on behavioural insight. Companies need to understand branch interactions, real catchment overlaps, and changing customer flows across their network. Structural models alone cannot fully answer questions related to cannibalization, multi-location behaviour, or the impact of infrastructure and mobility patterns.
In these scenarios, mobility data becomes essential because it reveals how customers actually move between locations and how footfall patterns change over time. POI-based Business Attractiveness remains valuable as a structural benchmark that supports long-term expansion planning and consistent location comparison.
Understanding the Limits of Location Movement Data
Although mobility data reflects observed behavioural patterns, it is still aggregated and anonymized. POI-based location models estimate demand using environmental context and spatial relationships. Neither dataset measures every individual visitor or customer journey.
For this reason, choosing between mobility data and POI models is not primarily about identifying which dataset is more accurate. Instead, it is about selecting the dataset that best answers the specific business and location planning question.
Combining Structural and Behavioural Location Intelligence with CleverMaps
CleverMaps integrates multiple spatial datasets into a unified Location Intelligence platform that supports both behavioural and structural location analysis.
Through the CleverMaps Data Marketplace, companies can access aggregated mobility datasets describing real movement patterns, curated POI datasets with Business Attractiveness scoring, and contextual datasets including demographics, purchasing power, and traffic statistics. These datasets can be analyzed together within CleverMaps Studio and enriched with internal business, CRM, or sales data.
This integrated environment allows organizations to compare candidate store locations, visualize market attractiveness, monitor network performance, and continuously optimize expansion strategy based on both observed behaviour and structural demand indicators.
A Practical Framework for Site Selection and Network Expansion
In most retail location planning and network optimization projects, dataset selection follows a clear logic. POI-based location models are most effective when companies need consistent structural comparison across many markets or candidate locations.
Mobility data becomes essential when the goal is to understand customer behaviour, visitor flows, and performance dynamics across a store network. For large-scale expansion or high-investment projects, combining both perspectives typically provides the most complete view of location performance.
If you want to evaluate which location datasets best support your site selection or network expansion strategy, CleverMaps geospatial specialists can help design an analytical workflow tailored to your market, location risk, and growth plans.