
Barbora Hinnerova
SOLUTIONS
7 MINS READ
Using CleverMaps to Analyze the Availability of Waste Separation Containers
See how CleverMaps analyzes waste container availability in Czechia. Learn how Location Intelligence improves placement, accessibility, and recycling.

Do you think that the availability of waste separation containers can significantly influence the quality of life in cities? Martina and Barbora, the graduates of Czechitas Data Academy, are convinced that hell yeah! That's why they decided to analyze the availability of waste separation containers for the residents of cities Prague and Brno for their final project.
What is the Analysis About?
Paper, plastic, clear glass, colored glass, beverage cartons, metals, biowaste, textiles, fats and oils, and electrical waste. All these things belong to separate containers. Where do we find these containers? Are the containers accessible to the residents? If not, maybe the residents are less likely to recycle.
Choosing the Right Tool
There are many analytical or GIS tools you can use. But the girls had clear criteria - the outcome has to be an interactive map with all the waste separation marked so the residents can easily find them and the city can determine where some kinds of containers are missing. Still, a lot of analytical tools allow viewing data on a map. The main problem with standard Business Intelligence tools was that the map shows only static data with no further possibility to combine, sort, and filter the data.
Looking into the array of GIS tools showed that this was not a way to do it either. Full cloud versions were unavailable, desktop versions were lengthy and complicated to set up and data preparation and visualizations were separated.
Martina and Barbora have chosen CleverMaps after a thorough evaluation, essentially because:
It wasn't enough to see the data on the map statically
In the CleverMaps platform, it is possible to analyze which and how many containers are within specific walking distance from each residential unit
Easy comparison of districts and residential units
The project shouldn't be just an analysis but a solution for the citizens and the city of Prague and Brno.
Straightforward data input because of the data connectors
Availability of data sets for immediate use, especially sociodemographic data, the administrative division of cities, buildings, etc.
Analysis and Visualization of the Data
The girls managed to collect the following datasets:
Waste collection yards in PragueSorted waste stations in Prague
Fats and oils in PragueContainers in Brno
Container station in BrnoBuildings in Prague and Brno
Sociodemographic data on Prague and Brno
Collection yards in Brno
Waste collection in Prague between 1998–2018
The datasets were imported to CleverMaps and sorted into a logical multidimensional spatial data model. Above the data model metrics were built and then was time to add the indicators, indicator drills, and makers.
There is also a possibility to modify the appearance of the dashboard and the view.

The Data Model in CleverMaps Semantic Layer.
The metrics:
Number of containers
Population
Number of households
Number of containers per 100 people
Number of people per container
Number of housing units (can be filtered by distance)
Number of housing units per container
Number of houses
Average minimum distance
Container availability index
The map is interactive, and it is possible to display information about the city as a whole or details of the city districts. It is also possible to filter a specific type of container for each city. Besides, every kind of container has its maker, which it sets the corresponding color of a pinpoint.
Let's See The Results
The girls were thinking it through! Not only that the map ca

Number of housing units per sorting container in CleverMaps Studio.
In general, paper bins are one of the most used types of waste separation containers. On average, citizens of Prague need to walk a little over 100 m to reach it; however, the CleverMaps platform helped to reveal buildings where residents need to walk over 500 meters. Well, who would want to walk that much, right? Now the city can quickly discover white spots like these and make a change.

Location of housing units in Prague, which are further than 500 m from a paper container.
CleverMaps can also be used when placing new types of containers in the area. The figure below shows the container for fats and oils, a new type of separation container. On the map below, we can see housing units that are further than 500 m from this type of container. Thanks to the exact distance to each housing unit, the city can effectively place them where needed the most.

Location of housing units in Prague, which are further than 500 m to the container for fats and oils.
CleverMaps also helped us discover that Praha - Běchovice does not have any bin for metal available at all. Its residents must walk over 15 minutes to the neighborhood to reach it. Missing container for metal in Praha - Běchovice
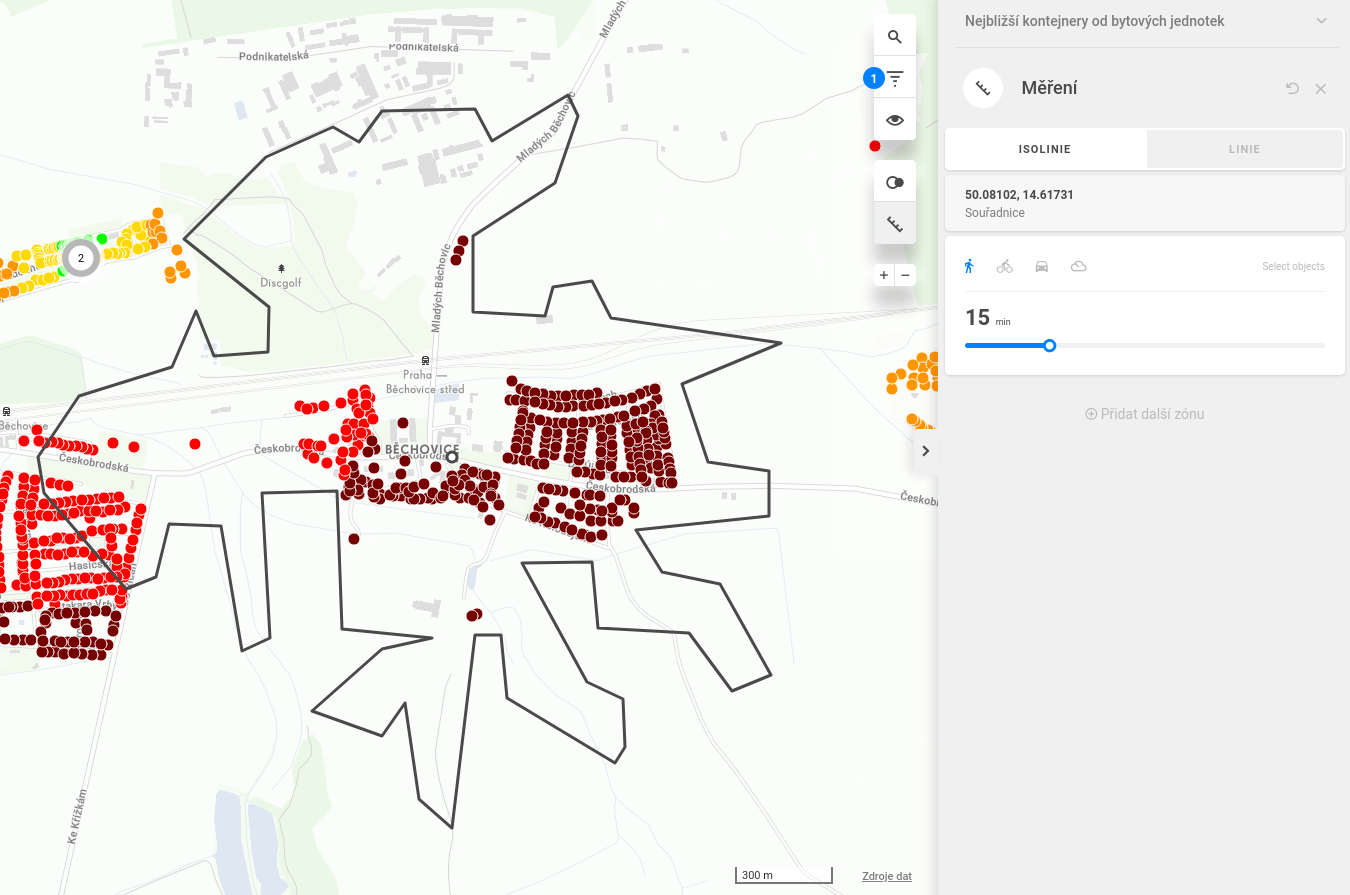
Missing container for the metal in Praha - Běchovice.
What if the city wants to compare two city parts? No problem! Thanks to the built-in function of the platform, you can choose parts of the city to compare, and the platform will do all the work. The figure below shows us the difference between Vysočany and Nové Město in comparison to the availability of containers for paper.

Comparison of two city districts directly on the map.
Working with CleverMaps
Martina Sukova working on the project concludes:
"Creating a project in CleverMaps went super smooth. We were surprised at what we could find out from spatial analytics. During the course, we were working with standard BI tools such as Tableau, Power BI and we never got to such deep insights. CleverMaps was absolutely the right fit for our project!"
Barbora Hubinkova from the project adds:
"CleverMaps platform helped us to analyze and see exactly what we needed. Not only we saw everything on an interactive map but the platform also provided us with a very detailed spatial analysis, which we were not able to get from any other BI tools."