Frantisek Pavlicek
SPATIAL EXPERTISE
8 MINS READ
The Secret of Successful Parcel Locker Networks: The Power of Location Data
Find out why precise location data is crucial for successful parcel locker networks. Learn how CleverMaps uses spatial data analytics to identify optimal parcel locker locations, ensuring convenience and efficiency for businesses and customers.

The image is a courtesy of DALL-E. Thanks, mate!
What makes a parcel locker network truly successful? The answer lies in the power of location data. Location data plays a pivotal role in optimizing the efficiency of parcel locker networks. By utilizing accurate and real-time location information, businesses can strategically place lockers in areas with high customer density, ensuring convenient access for users. This data-driven approach minimizes delivery distances and maximizes the utilization of lockers, resulting in improved service levels and reduced operational costs. Furthermore, location data enables businesses to identify emerging trends and patterns in customer behavior. By analyzing this information, companies can adjust their locker network strategies accordingly, ensuring the right number and distribution of lockers to meet customer demand. This level of insight empowers businesses to stay ahead of the game and deliver exceptional customer experiences. In this article, we'll delve into potential strategies and demonstrate how CleverMaps can assist in navigating this paradigm shift.
Why will the parcel lockers prevail
In the realm of Location Intelligence, the world of Where, the question of where you'd like your goods delivered was posed approximately 17 billion times last year in Central Europe alone. That staggering figure represents the volume of packages delivered throughout 2023. Of this total, over 10 billion were parcels collected by consumers. However, consumer preferences regarding order pickups have been changing dramatically. In the most developed countries, approximately 90% of packages are picked up from parcel lockers, compared to an average of around 40% in Central Europe. Nevertheless, it's anticipated that the new norm will stabilize at 50-60% of packages retrieved from parcel lockers – a trend companies must adapt to.

Do you remember these?
If you walked through densely populated areas in the cities a decade ago compared to today, you'd notice a significant difference. Today, within a five-minute walk, you're likely to encounter a parcel locker where once stood a telephone booth. The disappearance of phone booths, particularly accelerated by the COVID-19 pandemic, has paved the way for parcel lockers. In the Czech Republic alone, there are currently around 7,000 lockers, a number that's expected to grow. But what fuels the demand for these lockers, and why are they so widely embraced?
The answer lies in a combination of factors. Firstly, consumers value flexibility, and parcel lockers offer precisely that. With 24/7 accessibility, customers can retrieve their parcels at their convenience, regardless of store hours. According to Alza, the largest e-commerce platform in the Czech Republic, approximately 70% of customers prefer AlzaBox for delivery. Additionally, customers prioritize fast and cost-effective delivery, benefits that parcel lockers provide both consumers and businesses. PPL, another major carrier with its own locker network, says that delivering parcels to lockers is cheaper, faster, and more environmentally friendly than home delivery. Furthermore, lockers enable e-commerce businesses to reduce packaging, an increasingly critical factor. In essence, parcel lockers offer a win-win solution for both consumers and businesses, and it appears that they will be the go-to delivery way in the coming years.
How to find the right location for parcel lockers
Now that we've established the value of enabling customers to pick up their orders at a parcel locker, the next question arises: How do we find the optimal location for its placement? Whether it's for a single locker or an entire network, the answer lies in location data. The effectiveness of a locker hinges on the quality of its location. So, what steps do we take to find the perfect spot for a parcel locker?
Evaluating the existing parcel locker network
A strategic starting point is evaluating the existing parcel locker network, if applicable. With CleverMaps Platform, we analyze the locations of existing lockers and calculate numerous location parameters for each.
Key questions we address for parcel locker network optimization include:
Proximity to the nearest ATM
Population density within a five-minute walking radius
Exposure Index of the locker location
Purchasing power of the neighborhood
Information like this will undergo correlation analysis to determine the parameters that have the most significant impact on locker performance, both positively and negatively. Ultimately, we typically select around 5-7 key parameters for further analysis.
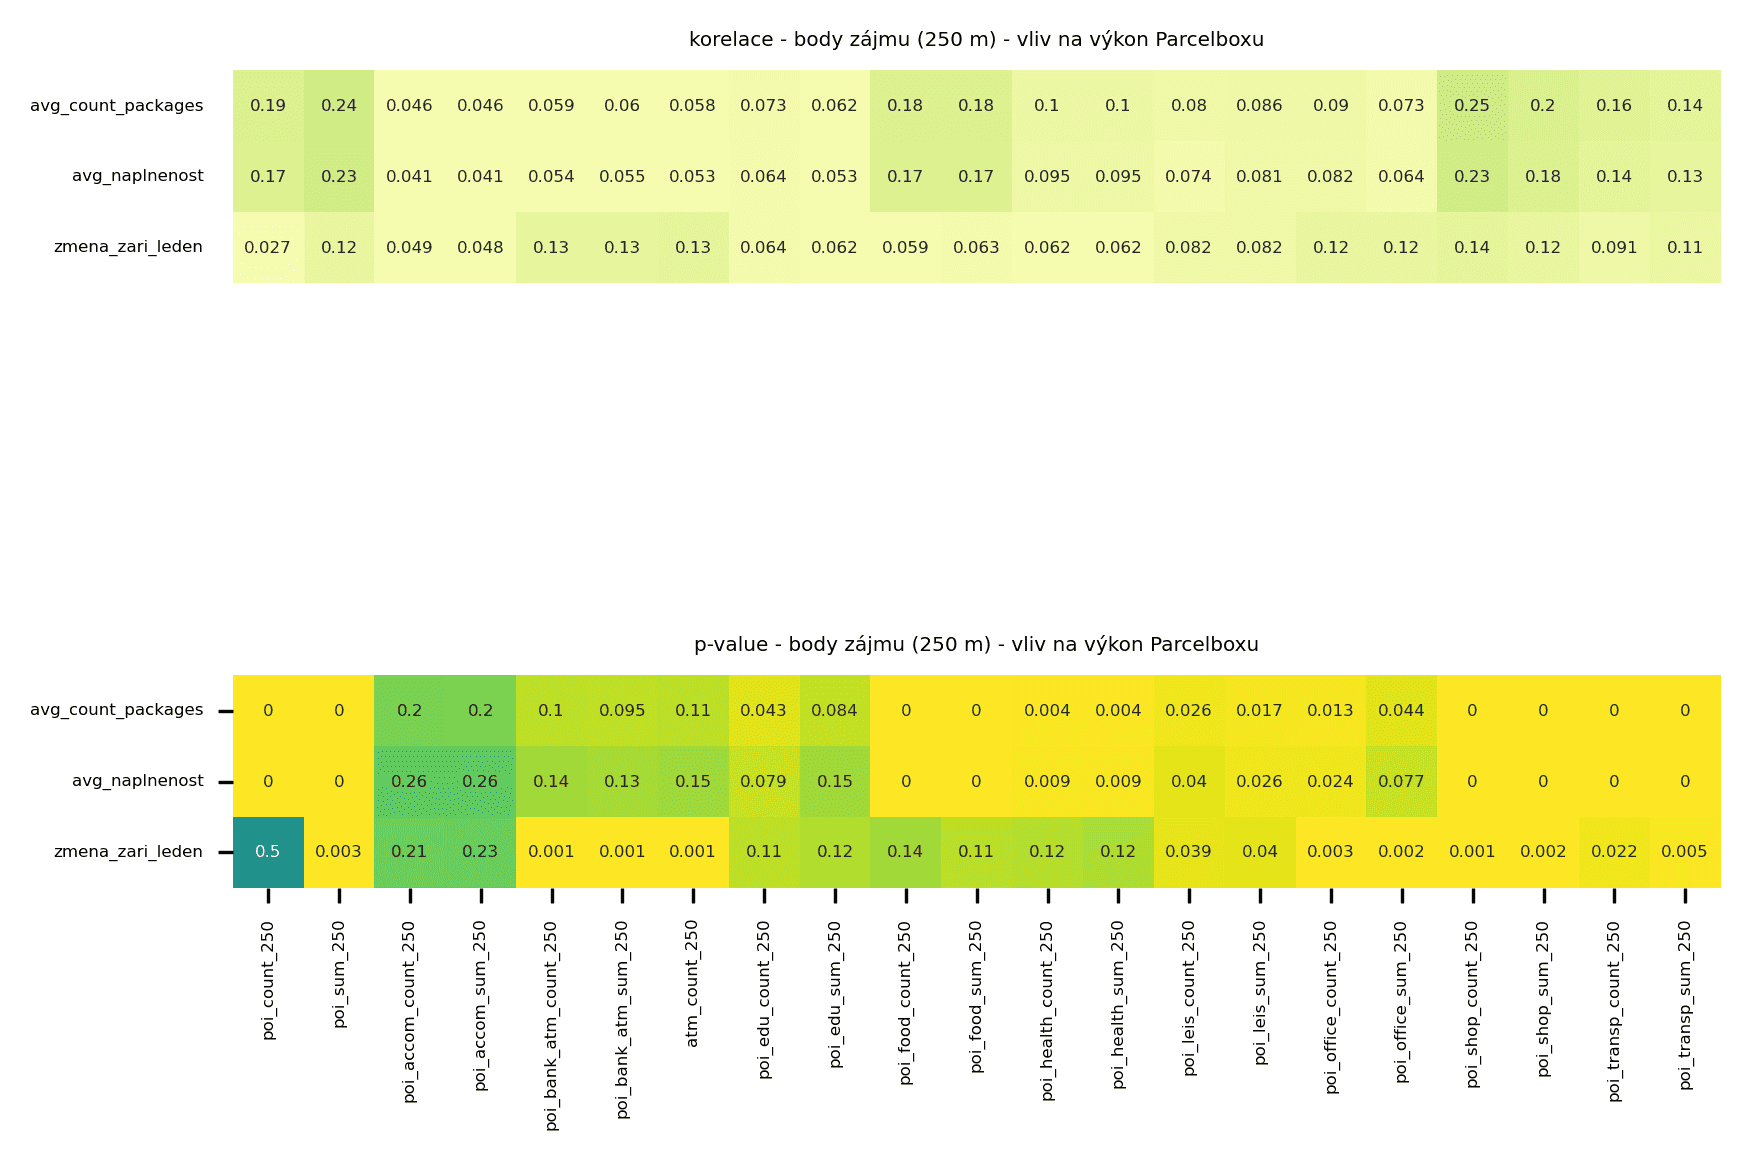
Testing POI categories against parcel lockers' performance.
Identifying the right locations for parcel lockers
The second step consists of identifying the locations that meet our predefined parameters. At CleverMaps, we commonly utilize an H3 grid structure for this purpose, as it is widely adopted, visually intuitive, and aesthetically pleasing.
Next, there are several methods available to identify the 'candidate' grid cells:
We can calculate an average value for each parameter and then search for grid cells with above-average values for as many parameters as possible, ideally all of them.
Another approach involves segmenting the evaluated area (e.g., a city) into smaller sections, such as municipalities with city districts or basic residential areas. We rank the values of each parameter within the area and then summarize the ranks to obtain a final number. The grid cell with the lowest value 'wins.' You would be surprised how often one or more lockers are already placed within this winning cell.
Grid evaluation: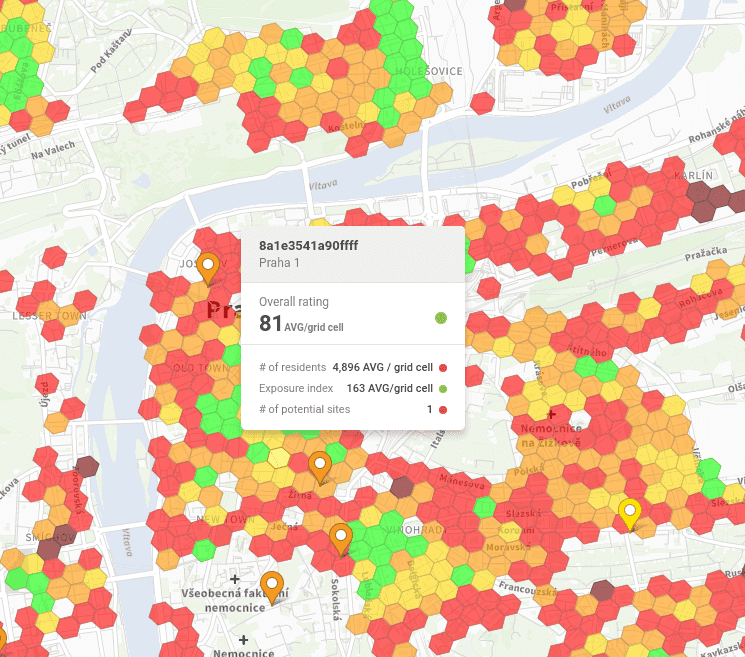
How to visualize the results of location data analysis
After identifying the KPIs for the parcel locker network, it's time to utilize your analytical tool, for example, our CleverMaps Studio. This tool enables us to visualize the lockers and their KPIs on the map, allowing us to identify potential spatial patterns in our data. We typically divide the results of the analysis into at least two dashboards: one displays the current network's performance, while the other enables us to visualize grid cells with calculated KPIs, aiding in the search for the ideal location for a newly placed locker.
Parcel Locker Network Performance Dashboard
The performance dashboard is a perfect match for the capabilities of CleverMaps Studio. It enables you to dice through the data with almost limitless filtering possibilities. Additionally, it allows you to visualize detailed data for any locker by simply clicking on it on the map or using it as another filter. Whether you share your lockers with partners and want to evaluate them by partner share, or you would like to explore the hourly occupancy of the lockers and check for those with low capacity during peak hours, Studio is the ideal tool for all these tasks. The depth of analysis is indeed up to you.
Performance dashboard in the CleverMaps Studio
Grid Cells Dashboard for Parcel Lockers KPIs
The other dashboard displaying the grid cells with the KPIs allows us to select the right location for each new locker. We often include pinpoint markers to visualize competitors' lockers, providing precise information about their positions and enabling comparison with your own location.
A significant advantage of using this map dashboard in CleverMaps is the ability to visually examine the selected location simply by right-clicking, which directs you to Google Street View or the Czech alternative called Mapy.cz Panorama. This feature fulfills all the needs of the expansion manager. Once you've chosen the right location, you can export the selected grid cell into a CSV file with coordinates or capture a screenshot of the map to provide to those installing the lockers on-site.
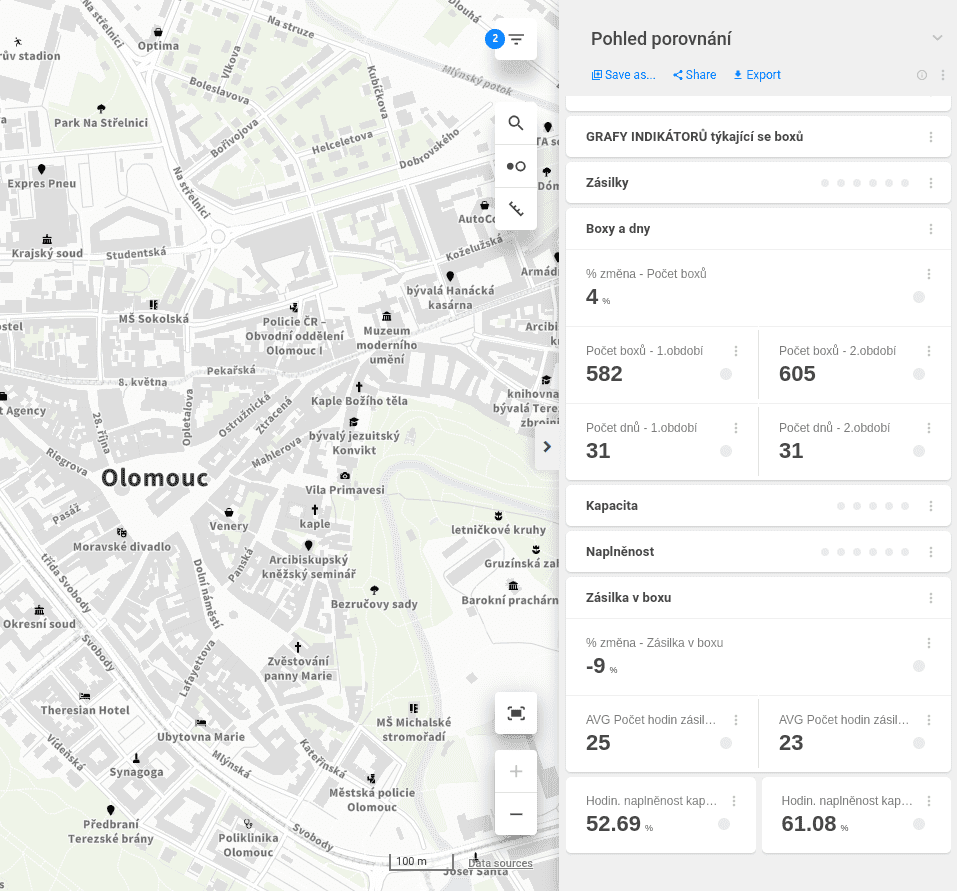
Comparison Dashboard for Parcel Locker Locations
There are certainly many more possibilities when creating dashboards for parcel lockers location evaluation. Another highly appreciated one in CleverMaps Studio is a comparison dashboard allowing us to study the differences between lockers in two different time frames or a location evaluation dashboard visualizing the number of people within walking distance of your choice. It’s only about your requirements and fantasy.

Comparison dashboard in the CleverMaps Studio.
Building a Successful Parcel Locker Network with Location Data
Parcel lockers are soon going to be the most popular way to deliver small e-commerce goods. The data suggests that and frankly, when you look around the street, it already looks like the parcel lockers have become a part of people’s everyday lives. But it’s not too late to join the mix–especially in certain countries or country parts.
Whether you are targeting smaller villages or the busiest parts of the cities, your locker needs to be well visible, rightly placed, ideally sized, and most importantly, full of packages! And that will only happen when the locker stands at the place where people are expecting it. Put your trust into data, and make your locker network the customers' favorite part of your business.
Read more about solutions for location strategy for parcel lockers at CleverMaps, or schedule a demo, and we will show you how we helped many of our customers to have a successful parcel locker network.