
Frantisek Pavlicek
SPATIAL EXPERTISE
8 MINS READ
Mastering Location Analysis Techniques: Location Data and Methods Explained
Discover why location analysis matters for your business. Explore key methods, essential data, and real-world examples in this comprehensive guide.
Mastering location analysis techniques is essential for success in a highly competitive market. By using location data, businesses can make informed decisions about facility location, where to open new branches, optimize current locations, and understand the factors that drive performance.
Location analysis involves evaluating various datasets, which helps businesses identify ideal locations, improve customer satisfaction, and enhance overall profitability.
Strategic location decisions are crucial in optimizing business performance by considering factors such as proximity to suppliers and customers, transportation costs, and labor availability.
In this article, we will explain what location analysis is, why it is important, and what location analysis techniques, methods, and data, are used to achieve optimal results.
What is a Location Analysis?
In our geo-focused world, location analysis is the process we use to understand how location affects your business’s performance. Utilizing geographic information systems (GIS), we can analyze spatial data to understand the impact of location on business performance. However, we can simply also use Location Intelligence tools like CleverMaps, to make this process more approachable to non-technical people. Location analysis is an ideal start when trying to understand what makes a perfect location for your type of business.
With the help of location analysis, we identify the positive and negative aspects of your current branch locations and suggest a methodology for evaluating potential new sites. Site analysis helps in evaluating potential new sites by comparing various locations based on customer demographics and preferences. Instead of relying on gut feelings, trust the data!
Why Do We Use Location Analysis?
When a client approaches us with a request to help them find a new ideal location for their business, we don’t want to play a guessing game. Instead, we try to quantify the parameters of the business’s locations and look for positive drivers of the current network to help us determine what type of location is the most beneficial for a store’s performance. That’s where location analysis plays a pivotal role.
We evaluate parameters like the population around the branch, the purchasing power of the inhabitants, or the number of daily visitors to the location. By incorporating demographic data, such as household income and population characteristics, we can identify market opportunities and the specific types of housing that may be warranted in certain areas.
All this has the same goal: finding dependencies or patterns between the location behavior and the store performance that we will later use for evaluating every other potential location where the client has an opportunity to open.
With the help of underlying spatial data, we can create scoring rules to automatically evaluate the key parameters of any location and know straight away whether this specific place offers enough potential to be considered as a candidate for a new branch. Additionally, evaluating location alternatives using various analytical techniques ensures we find the most beneficial sites for operational efficiency.
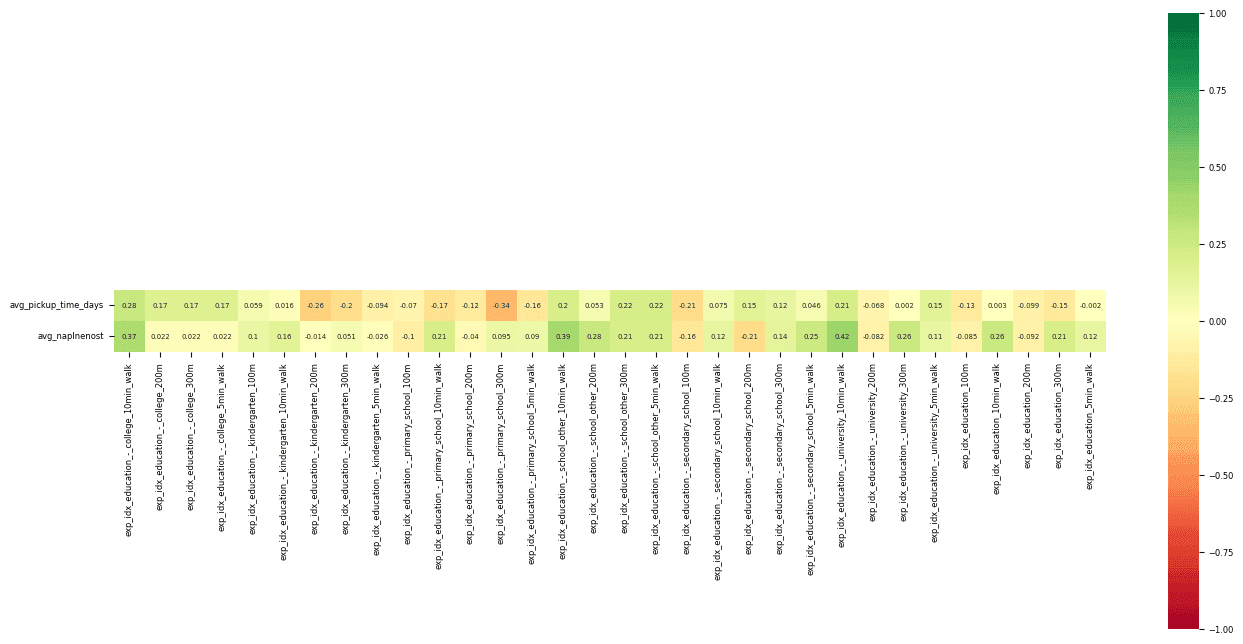
Example of a correlation matrix.
How to Approach Location Analysis When Evaluating Location Alternatives?
Although we have a lot of experience with finding a great location for various types of businesses, every client is a bit different. For example, one may have a strategy to look for the white areas on the map, while another decides to contest their competition directly. So it’s important to understand the client’s needs and conduct the analysis accordingly.
The strategy and vision are the most important parts of setting up the methodology, and that’s where the client’s cooperation is usually necessary. After we evaluate the current network and determine the success drivers (more on how we do it later), we try to use the newly gained wisdom to either suggest the best potential new locations for a store opening or create a methodology for evaluating every other location in the future.
We often employ the factor rating method to systematically evaluate potential locations based on numerous factors, assigning weights and scores to each factor for a comprehensive evaluation.
When the client wishes, we can apply the methodology straight away on a grid network and use it in any future case when it’s needed to quickly gain an idea about a location’s attractiveness. Considering relevant factors such as labor availability, infrastructure, and market access is crucial in this analysis to ensure informed decision-making.
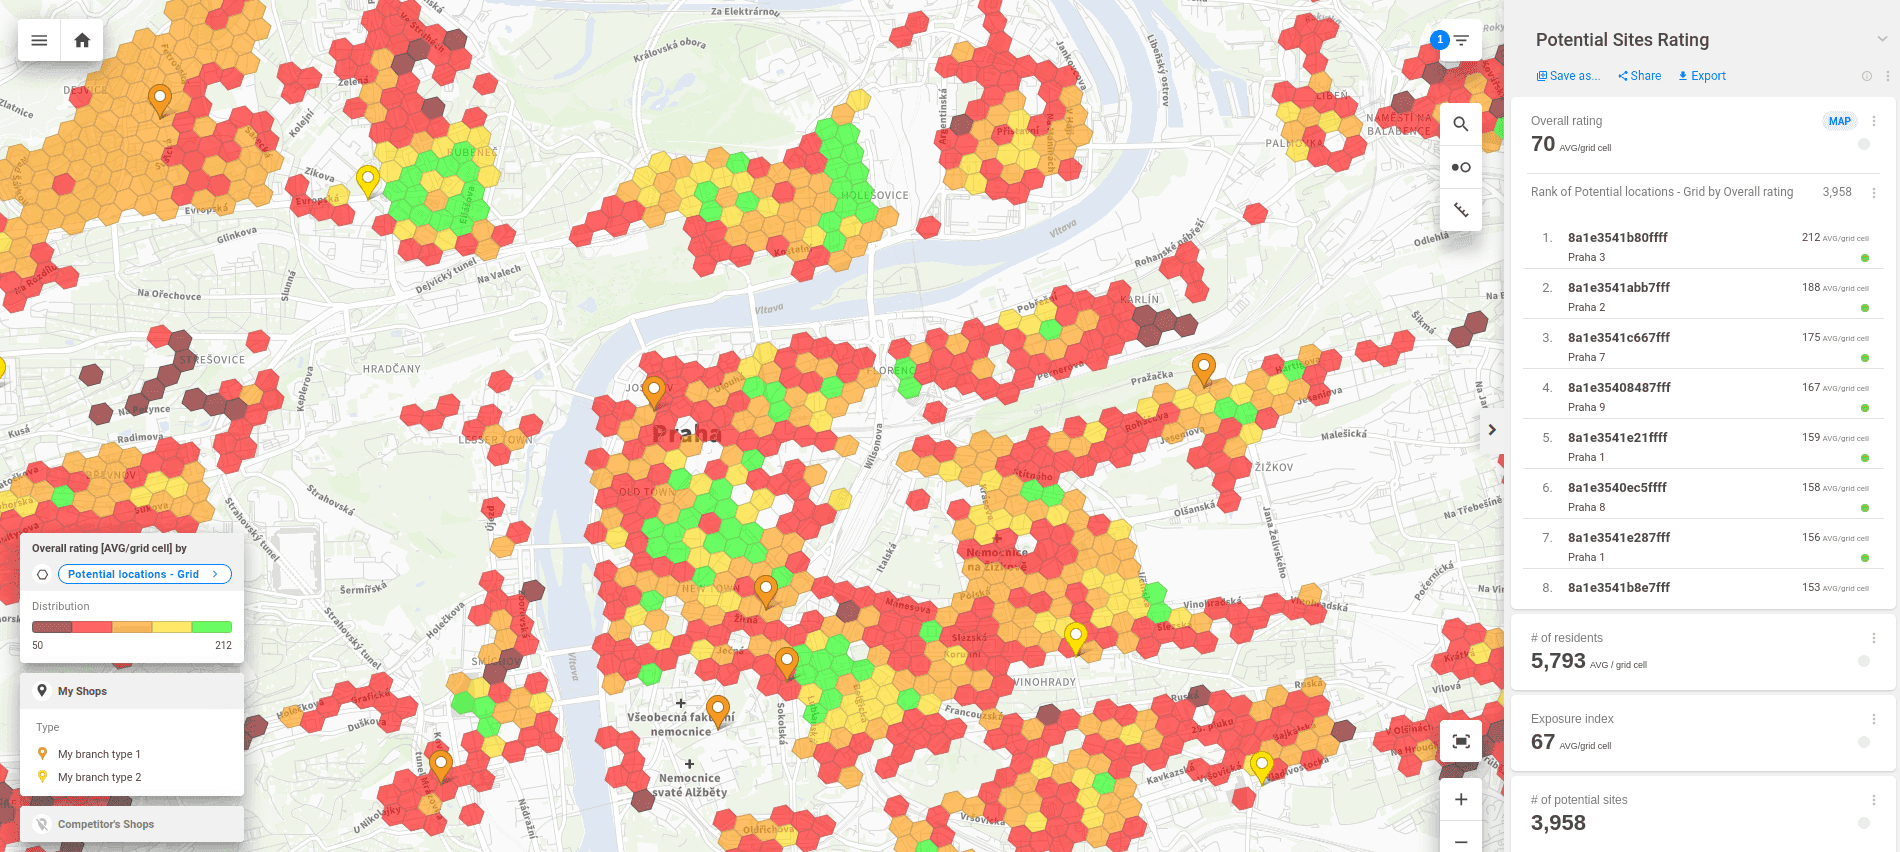
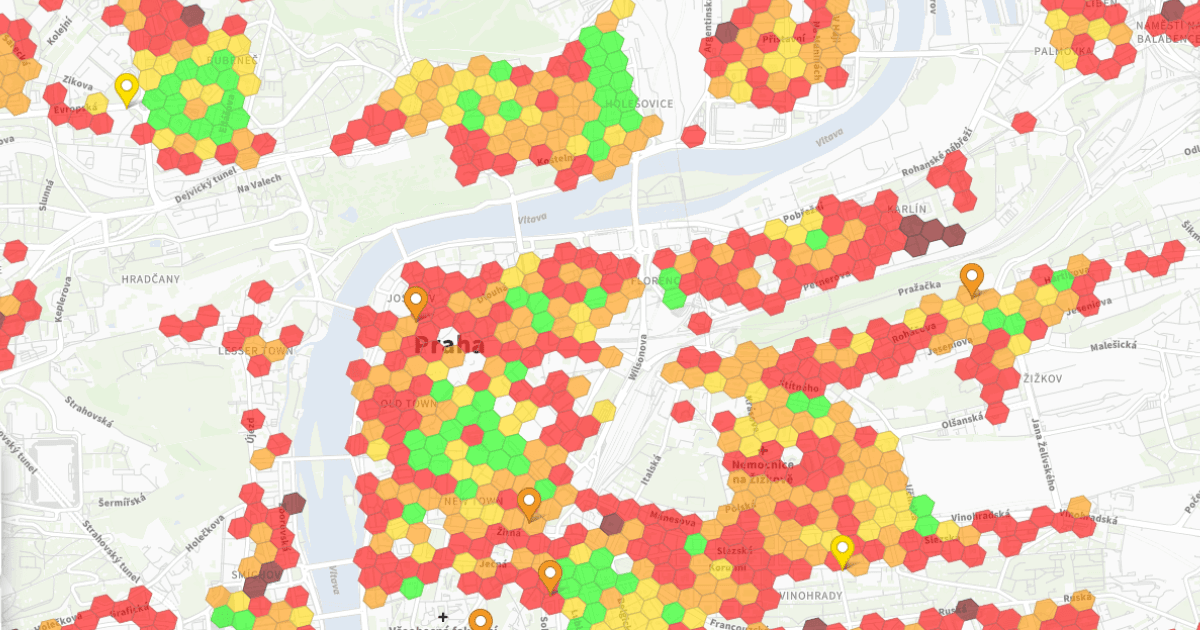
Example of a location analysis methodology visualized on a grid network.
Which Location Data Do We Use for Location Analysis?
The data we use depends on the customer’s goals and business type. Typically, for most clients, we utilize these datasets from our Data Marketplace. We also include data on existing facilities to assess new site options.
Demographics dataset - demographics data analysis reveals characteristics of a population in a certain area (age structure, income level, household type, population density, sex, etc.)
Types of Residence dataset - types of residence data analysis discover which type of building it is (residential, commercial, industrial, etc.)
Purchasing Power dataset - purchasing power data analysis identifies areas with high disposable income.
Transaction dataset - transaction data analysis helps to understand consumer preferences.
Human Mobility dataset - human mobility data analysis discovers areas with high foot traffic during certain hours of the day.
Traffic dataset - traffic data analysis shows locations with high vehicular traffic.
Point of Interest dataset - point of interest data analysis reveals the places frequently visited, their popularity, and the sentiment of places.
Competitor data - competitor data analysis identifies the locations and density of competitors in the area.
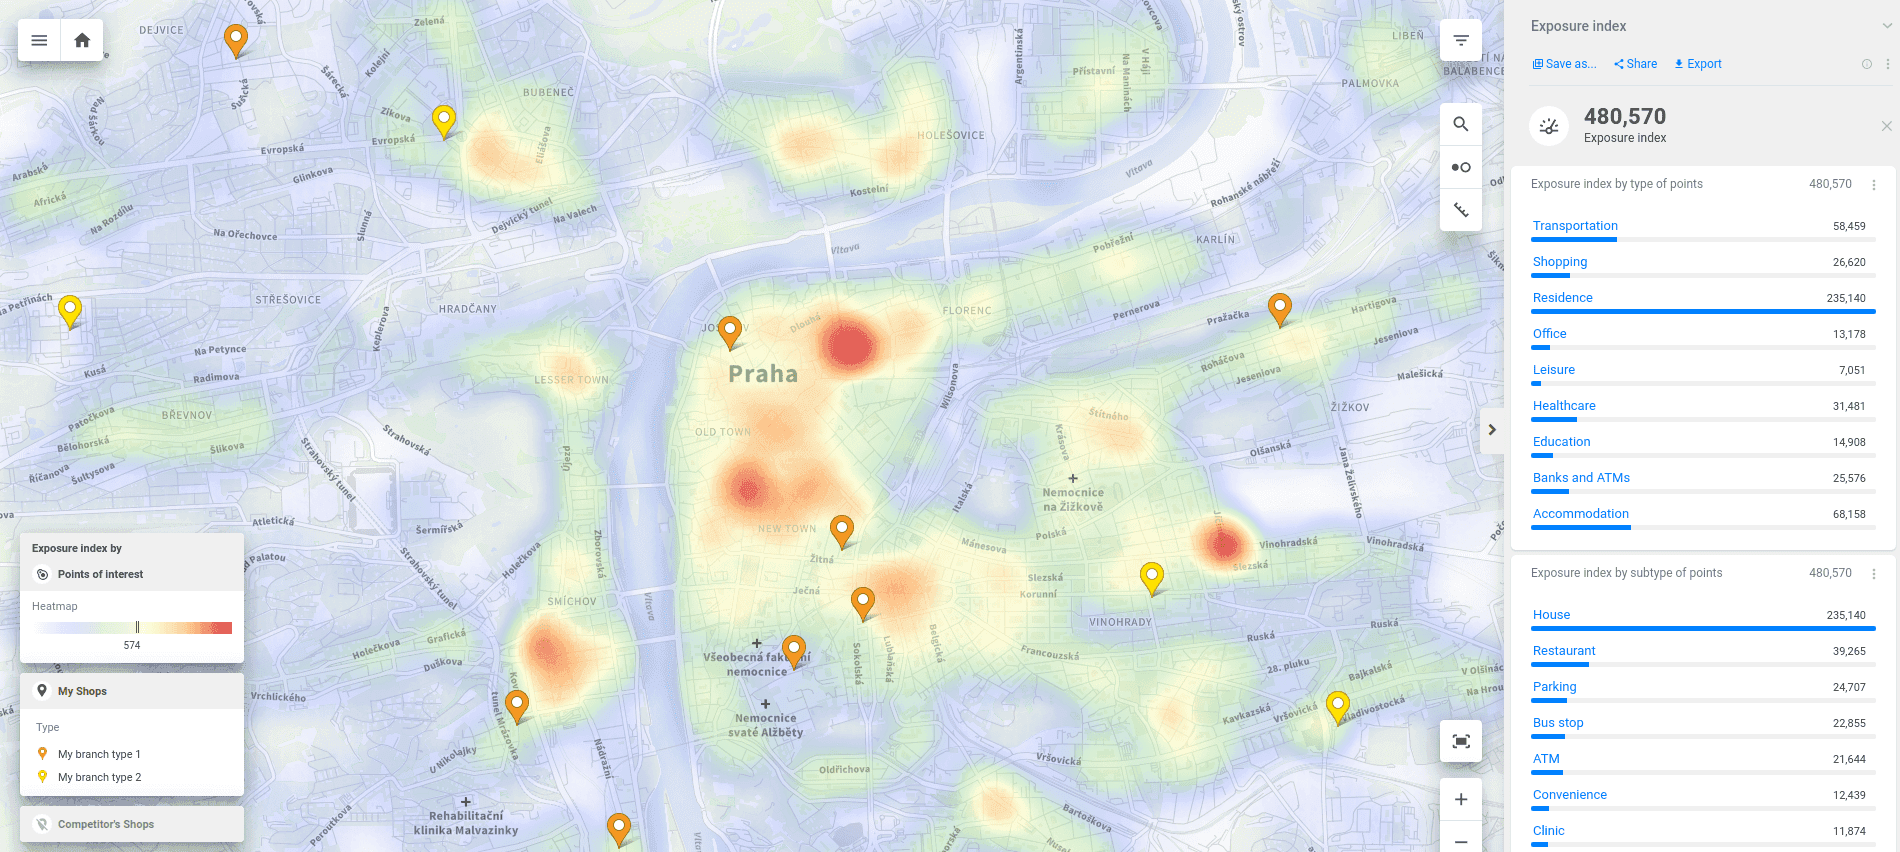
Example of a visualization of Point of Interest dataset in CleverMaps Studio.
What Methods Do We Use for Location Analysis?
So what do we actually do when we say, “Let’s do a location analysis!”? Well, simply put, we calculate the location parameters for each of the current stores or points of interest. A location parameter can be the distance to the closest restaurant, the number of people living in the surroundings, or the number of cars passing on the closest road per day.
There are actually hundreds of location parameters that we test, but to make it easier, we separate them into topics, such as demography, purchasing power, mobility, points of interest, transport, residence type, and a few others.
After this analysis is ready, we compare the location parameters with the performance parameters of the branches and look for patterns. Is the branch better performing when there is a bus station nearby? Or is it better when it’s distanced from its closest competitor?
We can also consider fixed and variable costs, such as rent, labor, utilities, and transportation, to accurately determine the break-even point and assess the financial viability of each potential location. Transportation costs play a crucial role in determining optimal locations, as minimizing these costs can significantly impact the overall efficiency and profitability of the business.
All that is statistically determined by running the correlation analysis and visualizing the data using box plots, charts, LASSO-F regressions, and other statistical methods.
This whole process is finalized with the data interpretation, which can be the most daunting task of them all. The resulting numbers and graphs need to be translated into findings that are easy to understand for the client and can be used later in the location evaluation methodology.
Some parameters, like population in the surroundings or human mobility, are easier to explain than the influence of the closest pharmacy on the performance of a bakery. However, in the end, we usually get to the outcome of specifying a few (3-6) key parameters to look for when choosing a new successful location for your business.
What Makes Location Analytics Services Good?
Of course, we are not the only company conducting location analysis for its customers. However, we consider ourselves specialists in the field as we have already done many of these analyses and, more importantly, we have a number of satisfied customers whom our analysis has helped achieve better results for their branches, parcel lockers, etc. Our analysis helps in identifying the optimal location for new branches by considering factors like accessibility, labor pool availability, and transportation costs.
We build our success on an individual approach to each of our customers. We always perform the analysis with regard to the client’s wishes, we are willing to test their hypotheses and quantify their assumptions into easy-to-understand outcomes.
Moreover, the location analysis in CleverMaps can be just the first step toward a well-performing branch network. We will happily provide you with long-term support and all the suitable tools for the successful use of location intelligence in your company.
What Are the Outcomes of Location Analytics?
Whether it’s a high number of people living in the surroundings, their purchasing power, or a low number of competitors in the neighborhood, location analysis will tell you all the key performance indicators (KPIs) of your branches. The analysis also helps in minimizing distribution costs by determining the optimal placement of facilities.
The outcome of the analysis can be summarized into a set of recommendations or a PowerPoint presentation, but the way to get the most out of the analysis is by using the results to set up a methodology for evaluating any possible location.
That way, when you find an empty spot that seems perfect for your next branch, you can calculate its potential with a simple click on the map.
What Are Examples of Spatial Analysis Results?
Let’s look at some real-world examples. How has location analysis helped our clients across industries like retail, FMCG, banking, insurance, and delivery services?
For instance, imagine an insurance company undergoing a merger, suddenly managing 800 branches, many of which are close to each other. How do you decide which particular locations to keep while ensuring client access? This was the challenge faced by Generali Česká pojišťovna, part of Generali Group.
They leveraged location data, including population, Exposure Index, Points of Interest, and competitor locations. With the help of CleverMaps Studio, they visualized which branches best served their clients, reducing the number of branches from 800 to 520 without sacrificing their profitability and customer satisfaction.
Selecting a particular location impacts decision-making for businesses by considering various factors such as proximity to suppliers and customers, transportation costs, and labor availability.
Read more about our location analysis success stories in our Case Studies. Get inspiration on how location analysis can improve your decision-making in business, and if you still need help with your location analysis, our team of GeoSpatial Experts is at your service–see how.